Mathematics
From questions to insights, 30online scientific tool. No registration required, free calculation and export.

Chaos & Fractals
Explore parameters and structure from Lorenz attractors to Mandelbrot sets.
Lorenz uses adaptive integration; Mandelbrot uses finite iteration escape time. Long-term chaotic trajectories cannot be accurately predicted.

PDE Laboratory
Compare the evolution of heat conduction, fluctuations, reaction diffusion, and viscous flow.
Periodic boundary one-dimensional heat equation, wave equation, viscous Burgers equation; two-dimensional Gray–Scott reaction diffusion. Fixed grid, showing discrete methods and limitations.

Geometry Explorer
Rotate the four-dimensional hypercube, or observe the torus parameters and sections.
Four-dimensional hypercube perspective projection and w=constant slice; three-dimensional torus and plane section. Arbitrary manifold intersection is not implemented.
Linear System Solver
solves a square matrix linear system and reports condition numbers and residuals.
Up to 50th order real square matrix; pathological system prompts unreliability.
Symmetric Eigensystem
computes the eigenvalues and eigenvectors of a real symmetric matrix.
Real symmetric matrix up to order 50; returns eigenvalues in ascending order.

Polynomial Roots
calculates the real and complex roots of polynomials and displays them in the complex plane.
Times 1–20; high-level or near-double roots may be pathological.

Polynomial Integral
calculates bounded integrals and provides accurate original function verification.
Real coefficient polynomial of degree 0–20 with limited integration interval.

FFT Spectrum
Computes one-sided amplitude spectra from equally spaced samples.
Real signal, uniform sampling, rectangular window; not power spectral density.
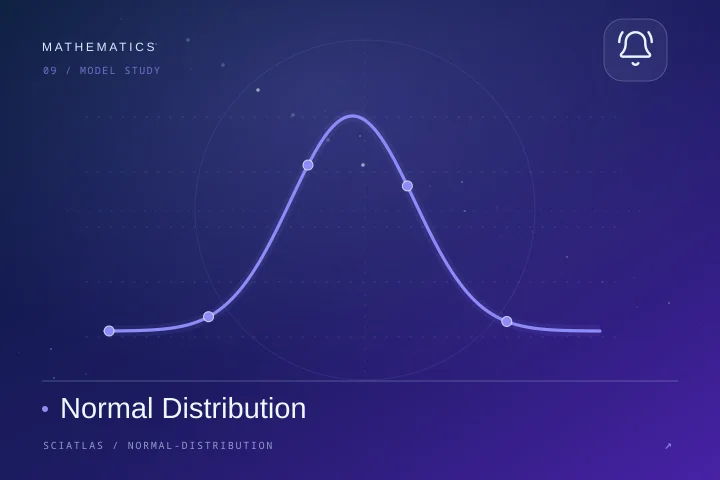
Normal Distribution
plots normal densities and computes interval probabilities and quantiles.
Continuous normal model with strictly positive standard deviation.
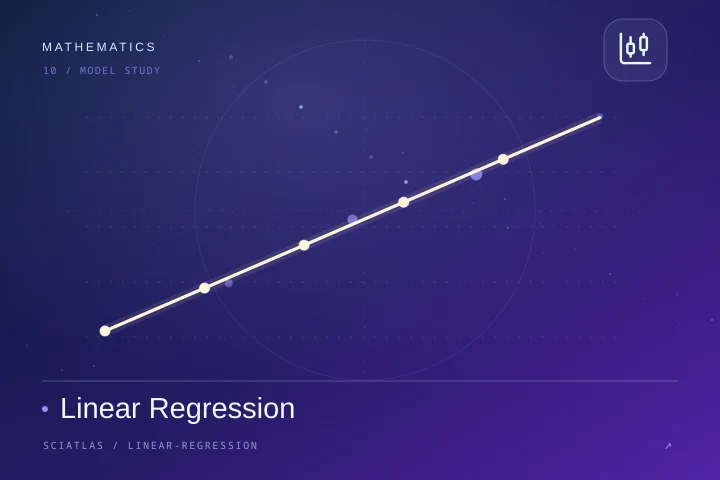
Linear Regression
fits a straight line to x/y data and reports slope, intercept, and R².
Ordinary least squares, inference relies on the assumption of independent homoscedastic errors; correlation does not equal causation.

Descriptive Statistics
Calculate the mean, median, sample standard deviation and range.
is a limited real number sample and does not automatically eliminate outliers.

Sample Quantiles
calculates empirical quantiles and interquartile range related quantities.
The quantile definitions of different statistical software may be different.

Pearson Correlation
Calculates linear correlation coefficients and two-sided zero correlation tests.
At least three pairs of independent observations, without testing for cause and effect.

Spearman Rank Correlation
Computes the rank correlation coefficient of a monotonic association.
p-values use asymptotic approximation.

One Sample t Test
tests whether the sample mean is consistent with the specified population mean.
Independent and identically distributed, normal population or sufficiently large sample; p-value cannot be interpreted as the probability that the hypothesis is true.

Mean t Confidence Interval
estimates the confidence interval for the population mean using the sample variance.
independent nearly normal samples, frequentist confidence coverage interpretation.

Numeric Histogram
counts frequencies by equal-width bins.
binning selection affects the visual form and does not automatically perform distribution fitting.

Moving Average
performs equal-weighted sliding window smoothing on equally spaced sequences.
Valid window only, no zero padding; may mask short-term changes.

Trapezoid Integration
Numerical integration of samples on non-uniform grids.
Linear interpolation within the segment, the error depends on the curvature and sampling grid.

Numeric Derivative
Estimates first derivatives for strictly increasing grid data.
At least three sampling points, no automatic filtering.

PCHIP Interpolation
performs single-tone segmented cubic interpolation on the data.
does not extrapolate, and the local conformality does not represent the real function behind the data.

Polynomial Least Squares
fits a polynomial of specified order and outputs the sum of squared residuals.
does not provide prediction confidence intervals.

Sample Autocorrelation
Computes the normalized lagged correlation of equally spaced series.
Up to 2000 points, assuming consistent sampling intervals.

Singular Value Spectrum
Computes the singular value spectrum of a real matrix.
Up to 400 elements, values close to zero are not automatically treated as exact zero.

Matrix Determinant
uses numerical linear algebra to calculate determinants and logarithmic absolute values.
floating point calculation, ill-conditioned matrices need to pay attention to numerical stability.

Binomial Point Probability
P(X=k)=C(n,k)pᵏ(1−p)ⁿ⁻ᵏ: Calculate the binomial distribution point probability based on the input, and provide local sensitivity curves and data export.
Independent and identical probability Bernoulli trials, the count must be an integer.

Poisson Point Probability
P(X=k)=e^(−λ)λᵏ/k!: Calculate the Poisson distribution point probability based on the input, and provide local sensitivity curves and data export.
Constant rate independent sparse event counting approximation.
Exponential Waiting CDF
P(T≤t)=1−exp(−λt): Calculate exponential waiting time probability based on input, provide local sensitivity curve and data export.
Time and rate must be units of each other, and there is no memory process.

Standard Normal Quantile
z=Φ⁻¹(p): Calculate the standard normal quantile based on the input, and provide local sensitivity curves and data export.
Standard normal distribution quantiles, not automatically applied to non-normal populations.

Binary Bayesian Update
P(H|E)=s p/[s p+f(1−p)]: Calculates binary Bayesian update based on input, providing local sensitivity curves and data export.
A given and calibrable conditional probability; cannot be updated with zero evidence probability.
Understand the method and then start calculating
Tools in this field provide runnable examples, model conditions and method descriptions. Please select a model that meets the experimental conditions and retain parameter and version information.
Connect knowledge with each other
Related disciplines and tools In the initial calculation of
Quantum Science ↗matrix and quantum state
Aerospace ↗Power system and state estimation
Pharmacokinetics ↗Statistical inference and parameter estimation